The art of scheduling a breakdown service
Many project-based companies must be available to their clients 24 hours a day. For this, they have to set up a breakdown service and plan employees accordingly.
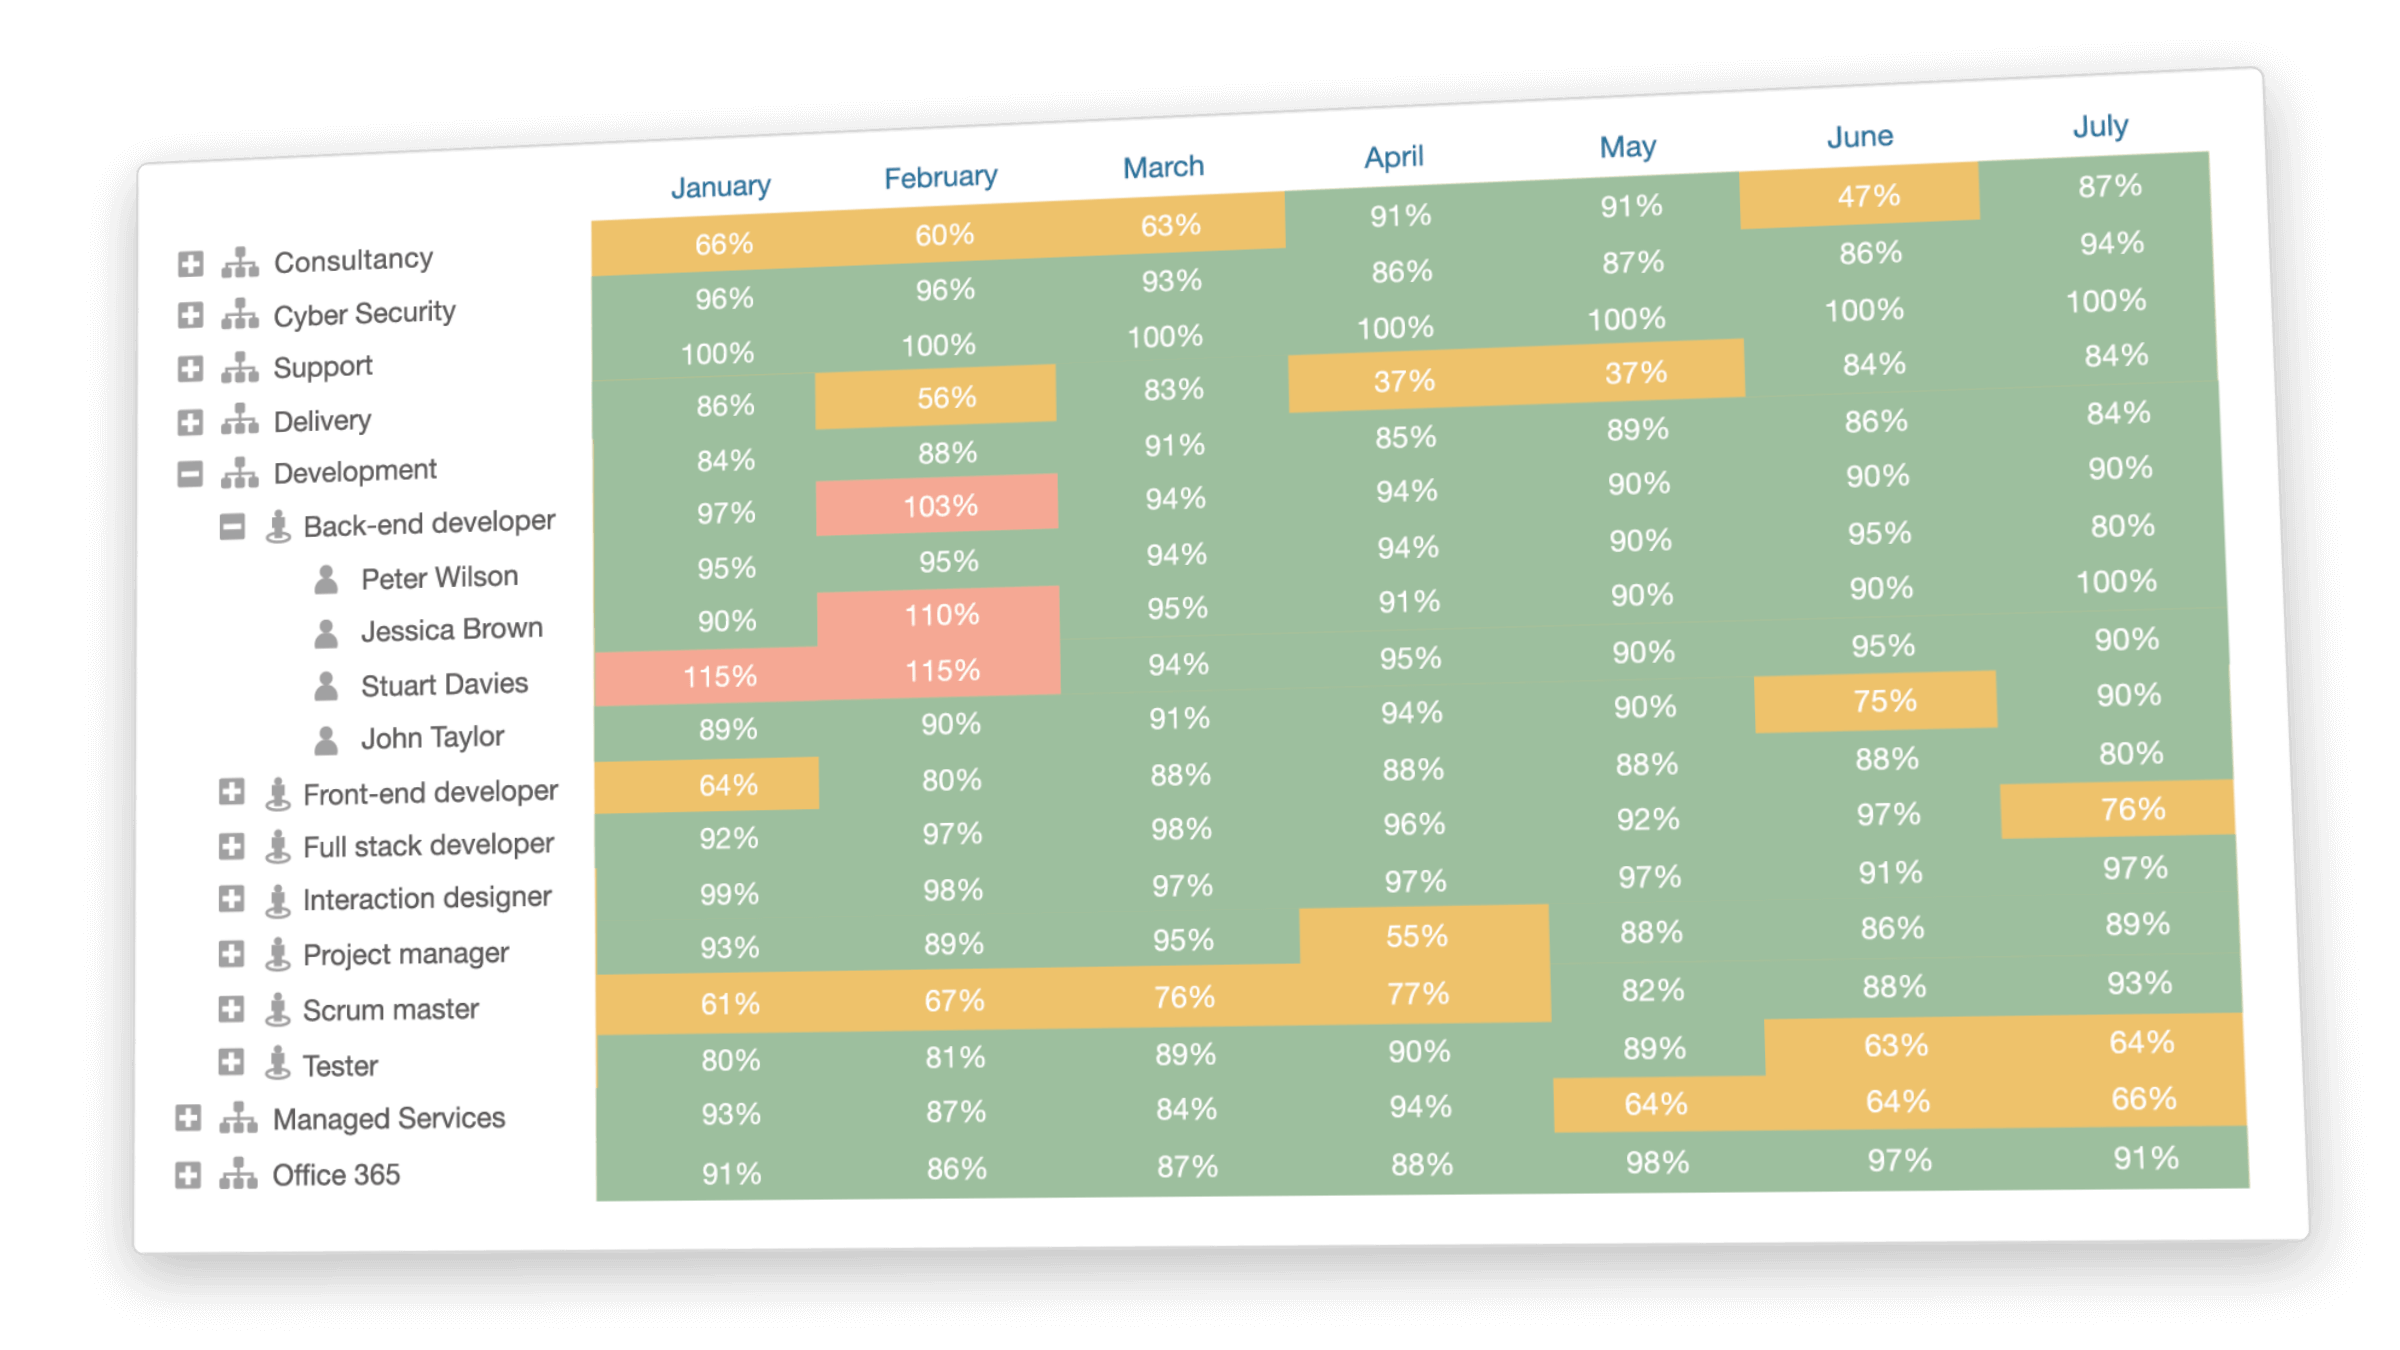
Statistics you can trust. We let you focus on the exceptions in utilization and budget deviations.

Expand to drill down
to the details
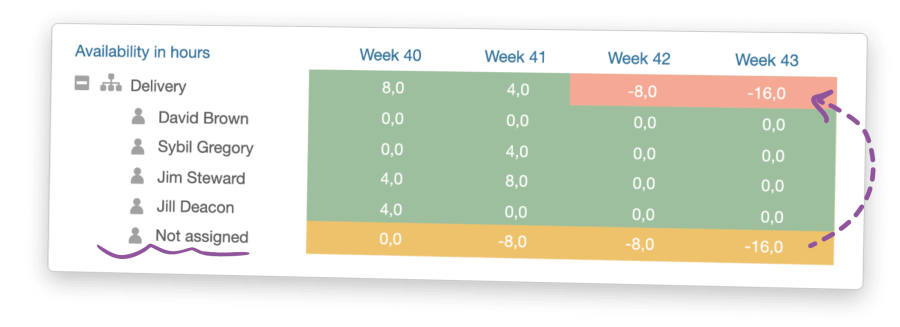
Get a crisp idea on what demand is coming from future work. This way you anticipate when you are running short of resources.


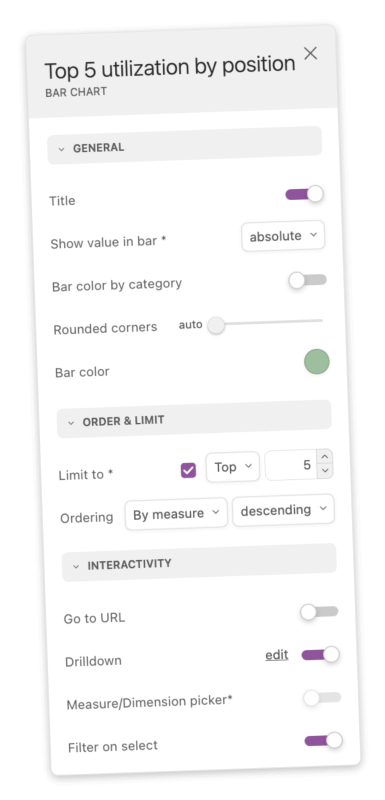
From simple adjustments like color and showing values to how you want to drill down and which measures you want to see.


Many project-based companies must be available to their clients 24 hours a day. For this, they have to set up a breakdown service and plan employees accordingly.

Clients regularly ask us which monitor they should buy to display our planning board on a large scale. To purchase such a monitor, you should pay attention to the following.

Planning for one person is sometimes challenging, let alone for 15, 70, or 200 colleagues. Then scheduling without the correct tools is an almost impossible task.